Skip to content
Ownlisted
ResearchData & PressDirectory
OwnlistedResearchThe 2026 US Truck Accident Attorney Landscape: Where Victims Find Legal Help

Contents

  1. The Scope of Commercial Trucking Accidents
  2. The Representation Gap: Where Victims Have Fewest Attorneys
  3. The Attorney Market: Reviews and Market Concentration
  4. Frequently Asked Questions
  5. Methodology
  6. Cite this study
Download dataset (CSV)

3,272 records

Truck Accident Attorneys

The 2026 US Truck Accident Attorney Landscape: Where Victims Find Legal Help

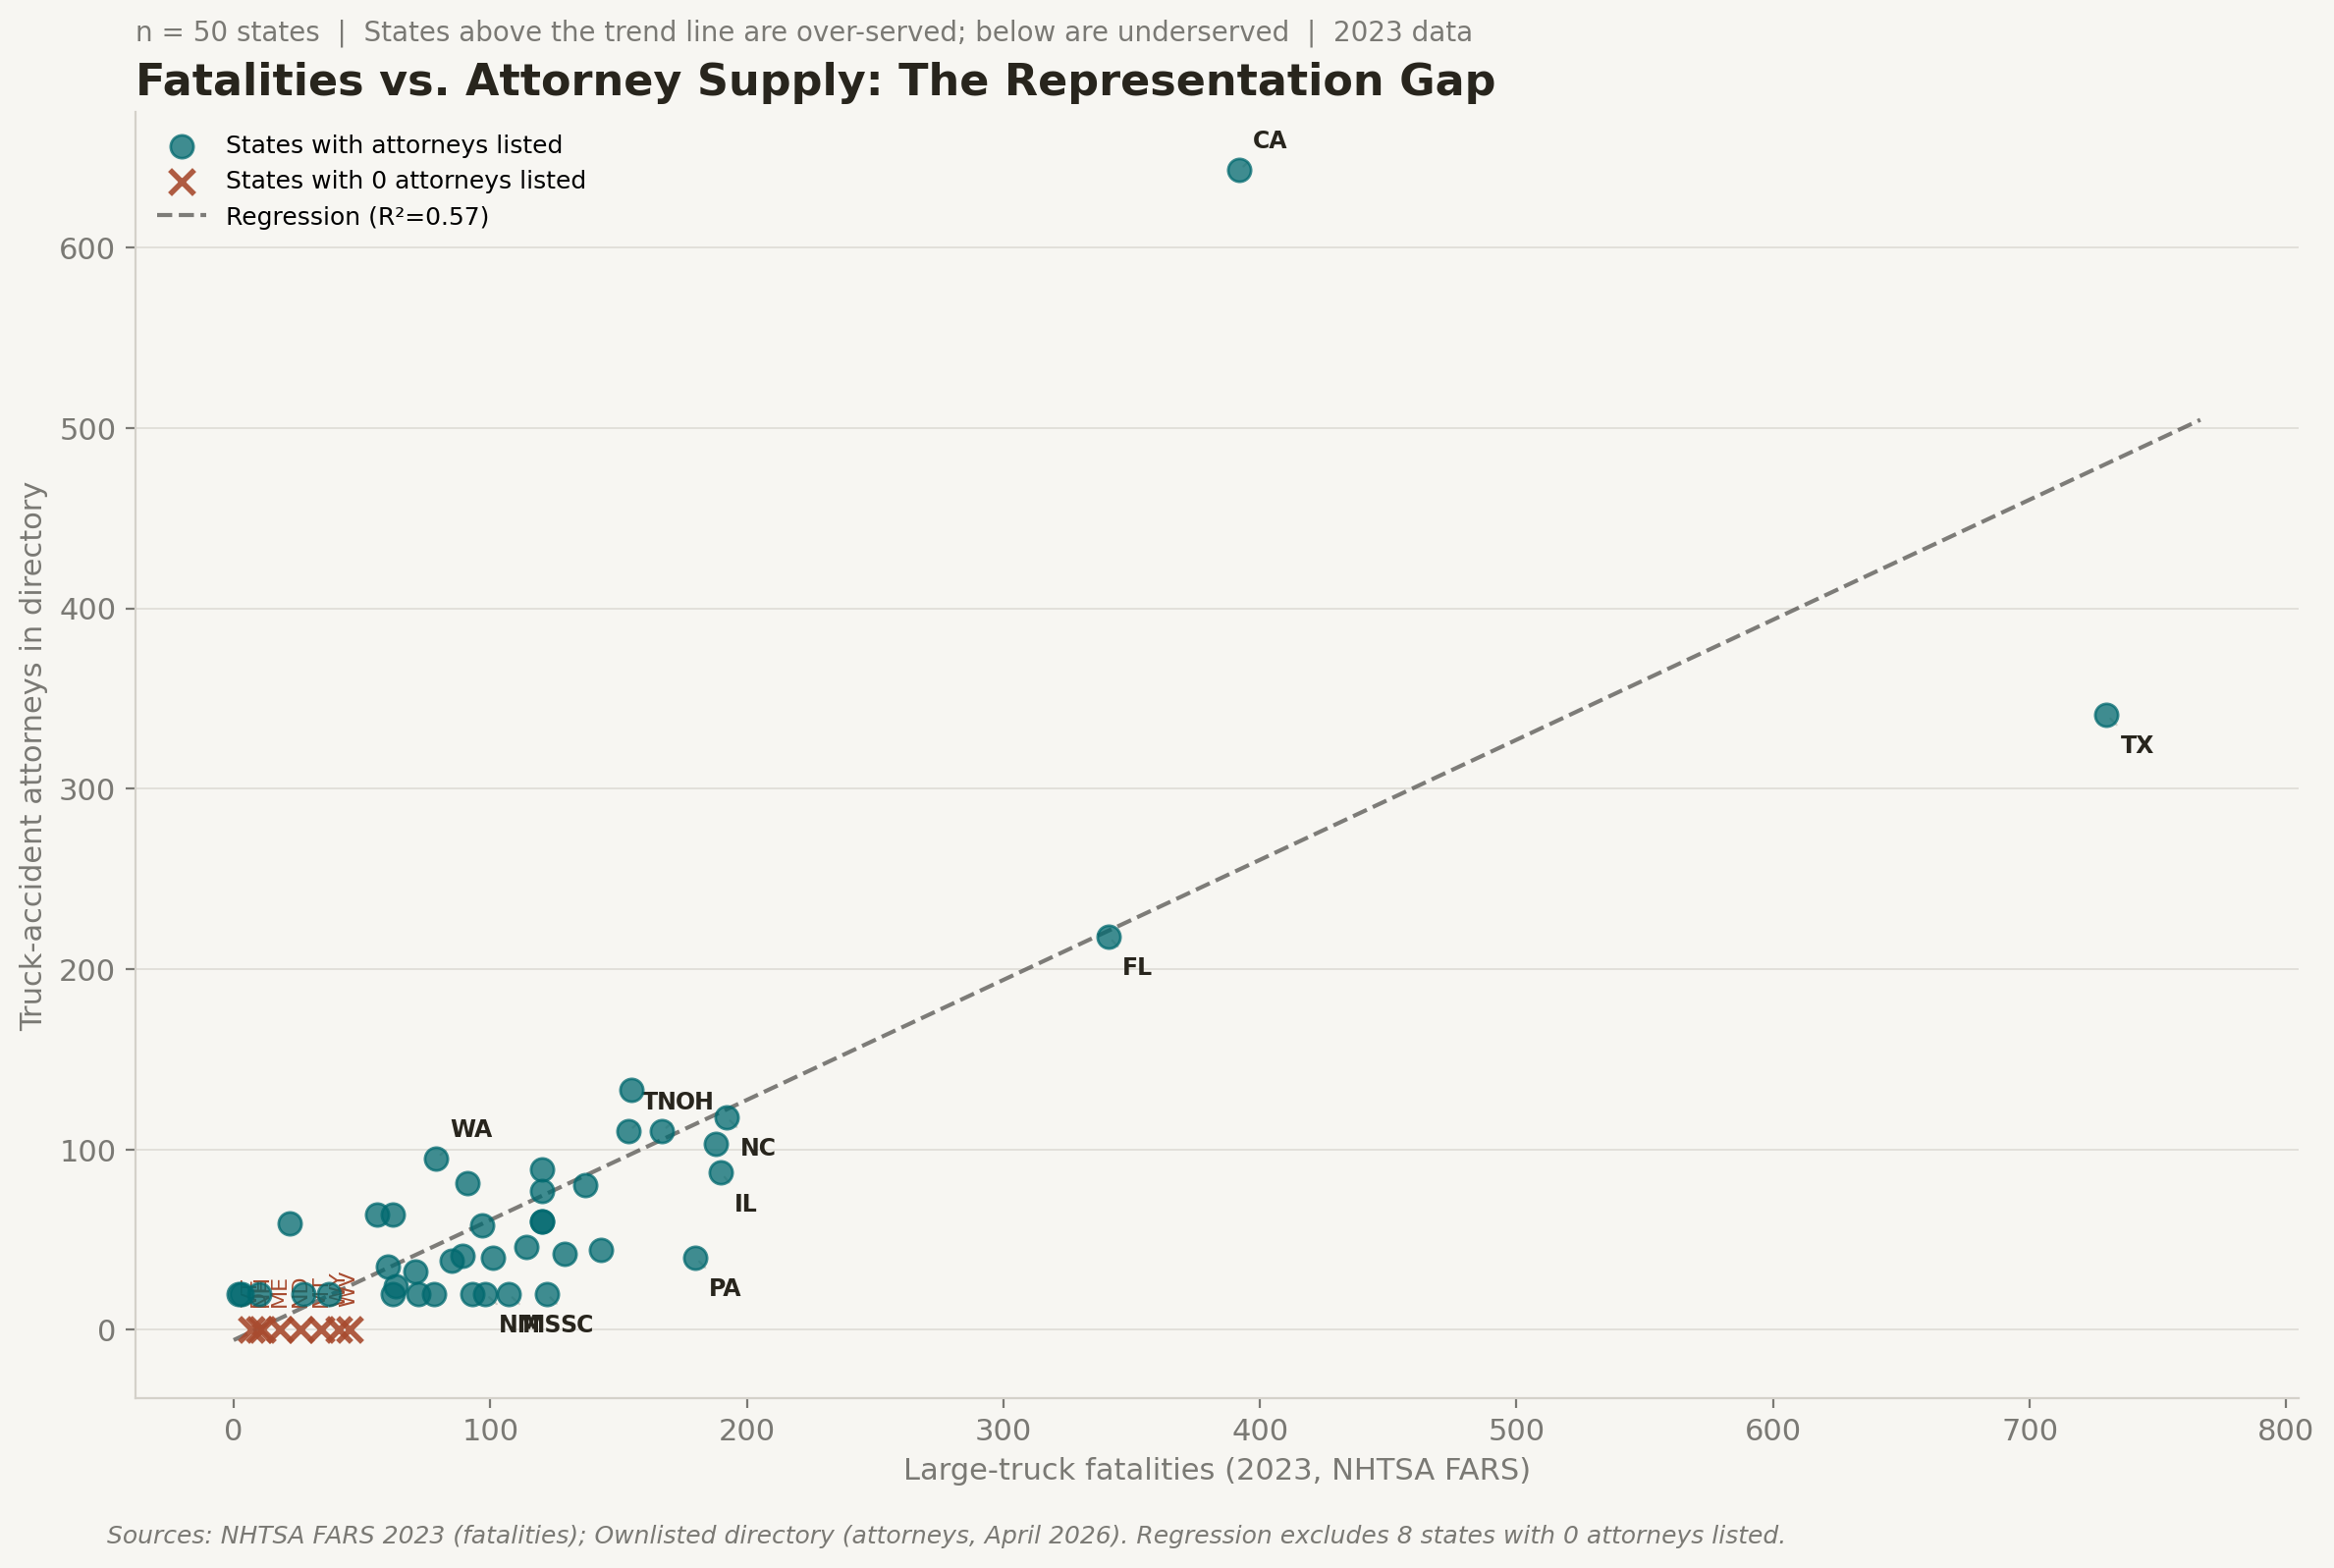
Three states account for 27% of fatal large-truck crashes — but carry 37% of attorneys. A state-by-state analysis of legal representation gaps using NHTSA 2023 fatality data and 3,272 directory attorney listings.

By Ownlisted Research·Published April 24, 2026·3,272 records·9 charts

Contents

  1. The Scope of Commercial Trucking Accidents
  2. The Representation Gap: Where Victims Have Fewest Attorneys
  3. The Attorney Market: Reviews and Market Concentration
  4. Frequently Asked Questions
  5. Methodology
  6. Cite this study

Executive Summary

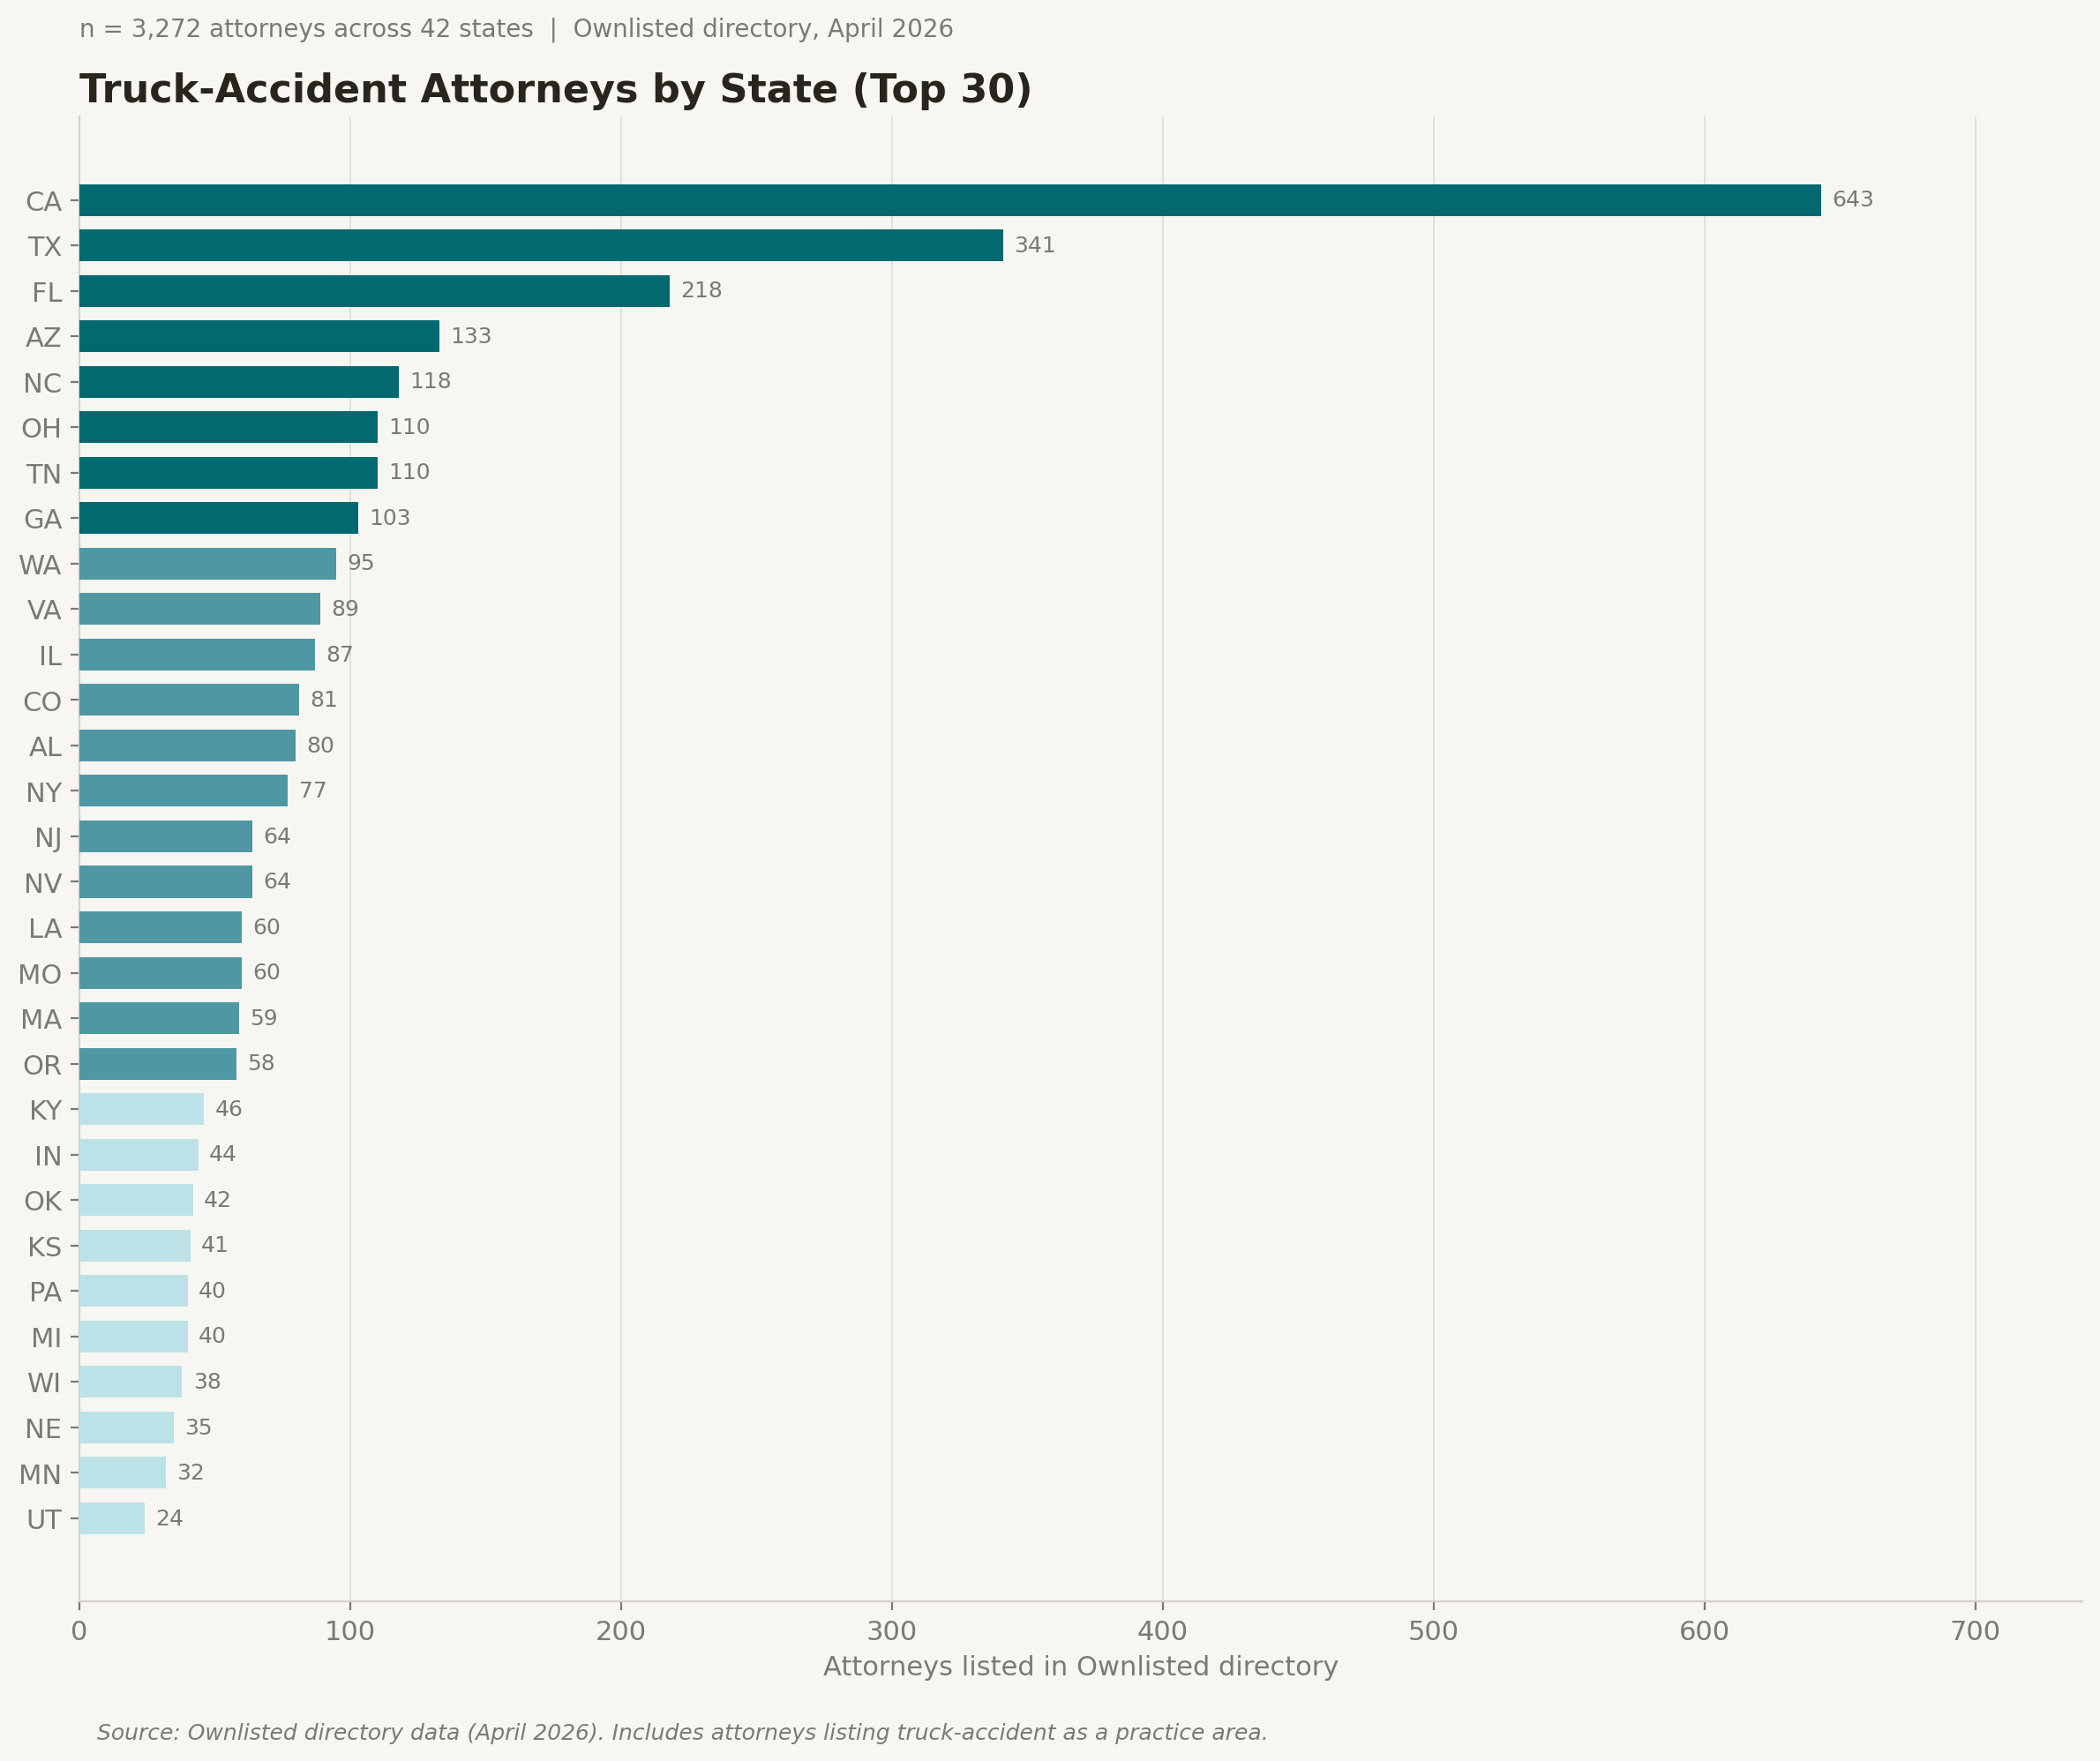
  • 3,272 truck-accident attorneys are listed across 42 US states and D.C. in the Ownlisted directory as of April 2026.
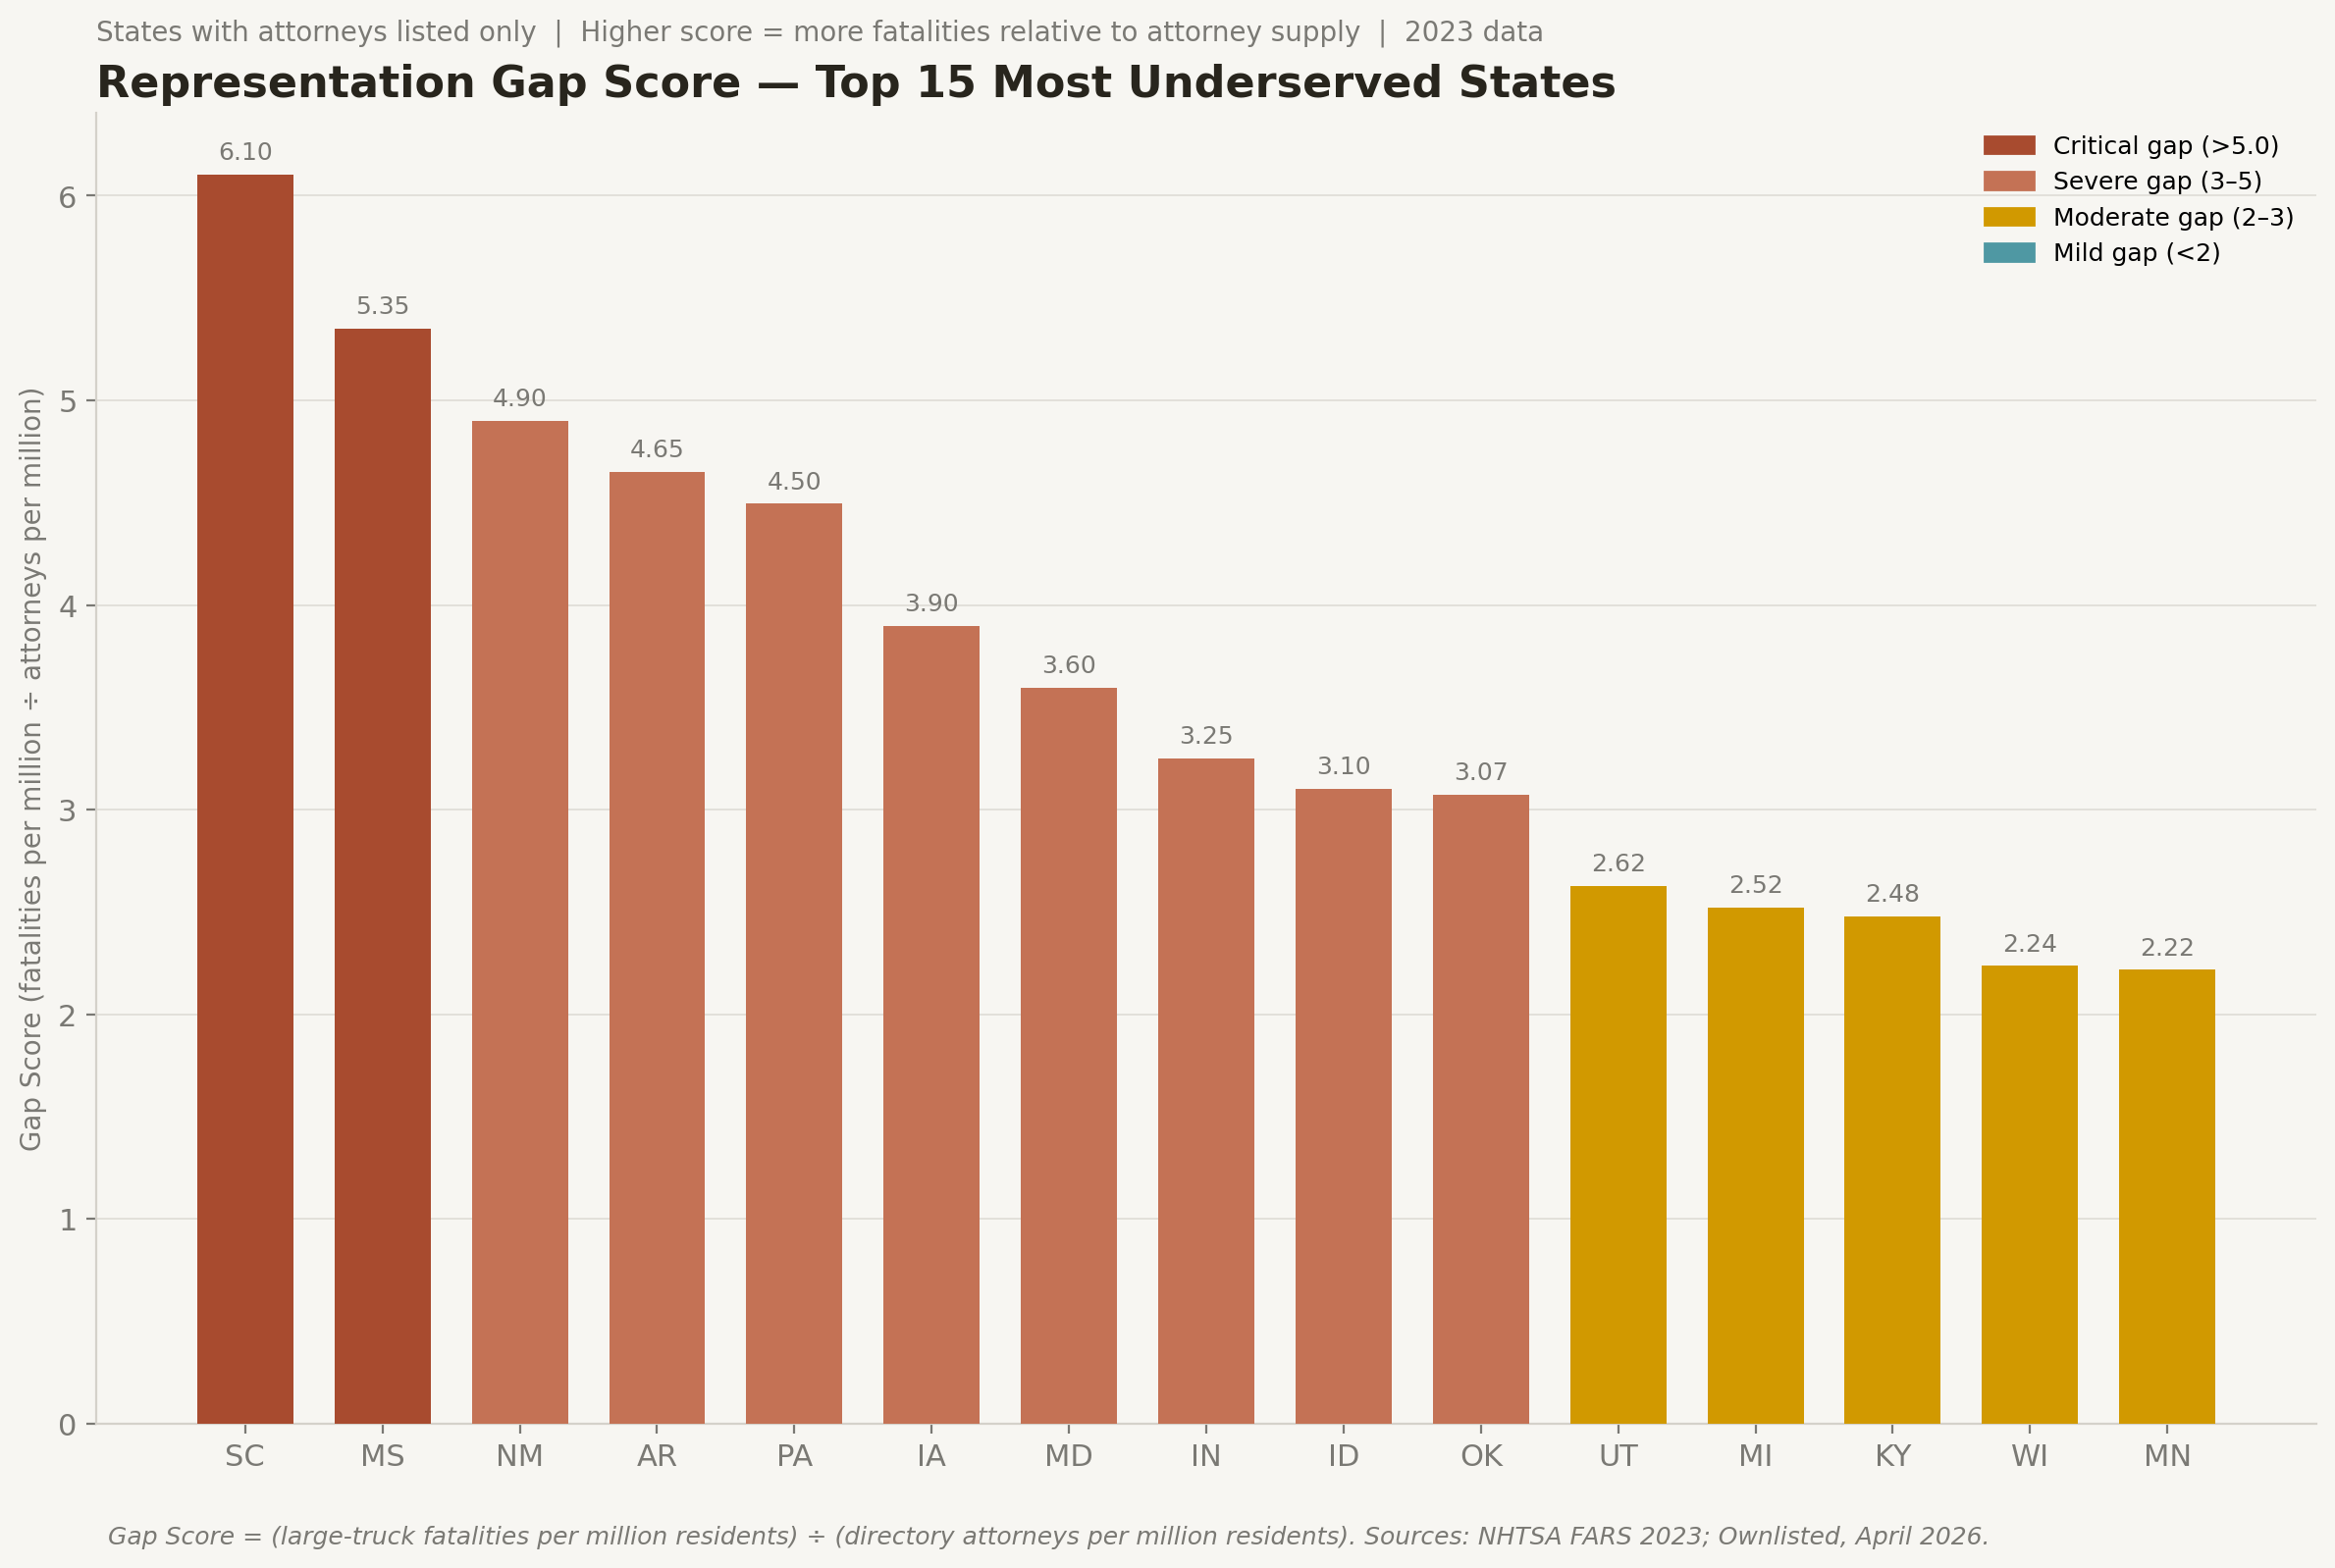
  • South Carolina has the widest representation gap: 22.7 large-truck fatalities per million residents against fewer than 4 attorneys per million — a gap score of 6.1.
  • Eight states — Wyoming, Montana, North Dakota, West Virginia, Maine, Vermont, Delaware, and New Hampshire — have zero listed truck-accident attorneys.
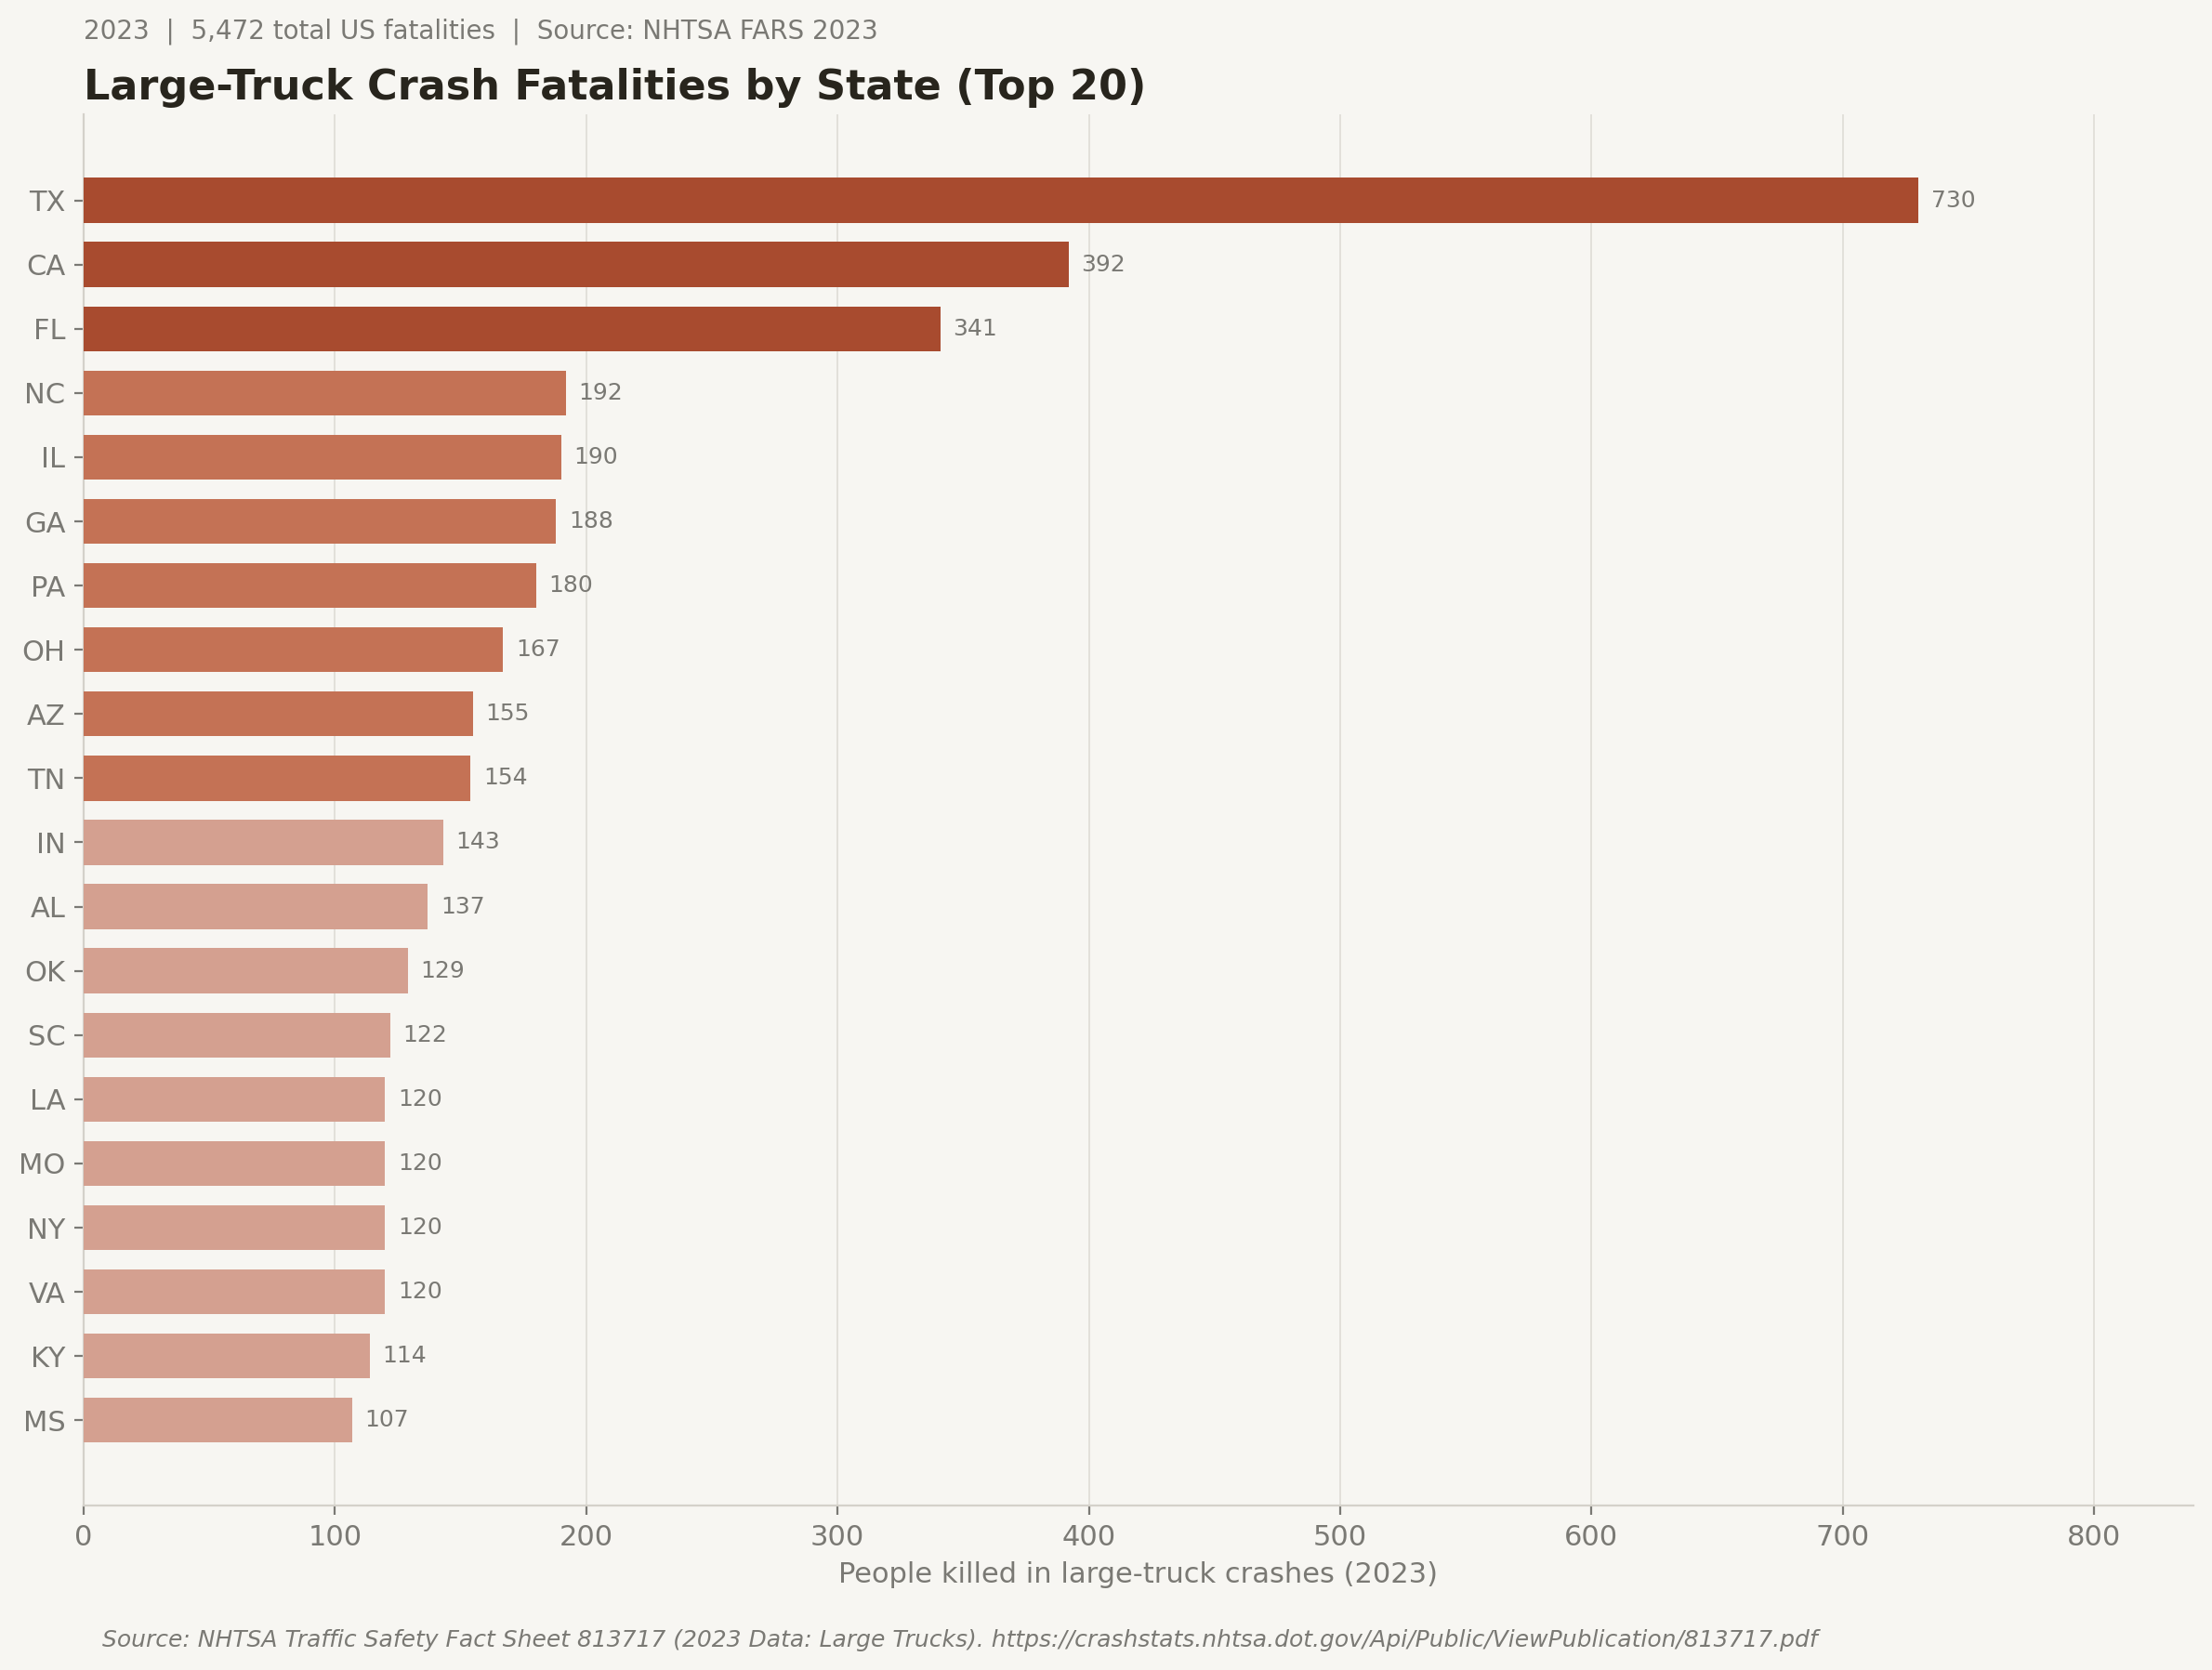
  • Texas logs more large-truck fatalities (730 in 2023) than the next three states combined, yet its attorney-to-fatality ratio is no better than the national median.
  • Rural freight corridors are structurally underserved: the five states with the highest fatality rates per million population all show gap scores above 3.0.
Download the full dataset (CSV, 3,272 records)

Key findings

3,272
Truck-accident attorneys listed
Across 42 US states and D.C. as of April 2026.
5,472
Large-truck crash deaths in 2023
NHTSA FARS 2023. 40% higher than a decade ago.
6.1
South Carolina gap score
The widest representation gap of any state with attorneys listed.
730
Texas large-truck fatalities (2023)
More than California, Florida, and North Carolina combined.
8
States with zero listed attorneys
Including Wyoming (highest fatality rate per million), West Virginia, and Montana.
110
Median attorney review count
Top quartile averages 500+ reviews — market is concentrated among established practices.

The Scope of Commercial Trucking Accidents

In 2023, the NHTSA Fatality Analysis Reporting System recorded 5,472 deaths in crashes involving large trucks — a figure 40% higher than a decade ago. Large trucks were involved in approximately 9.2% of all vehicles in fatal crashes, despite representing a smaller share of total miles driven.

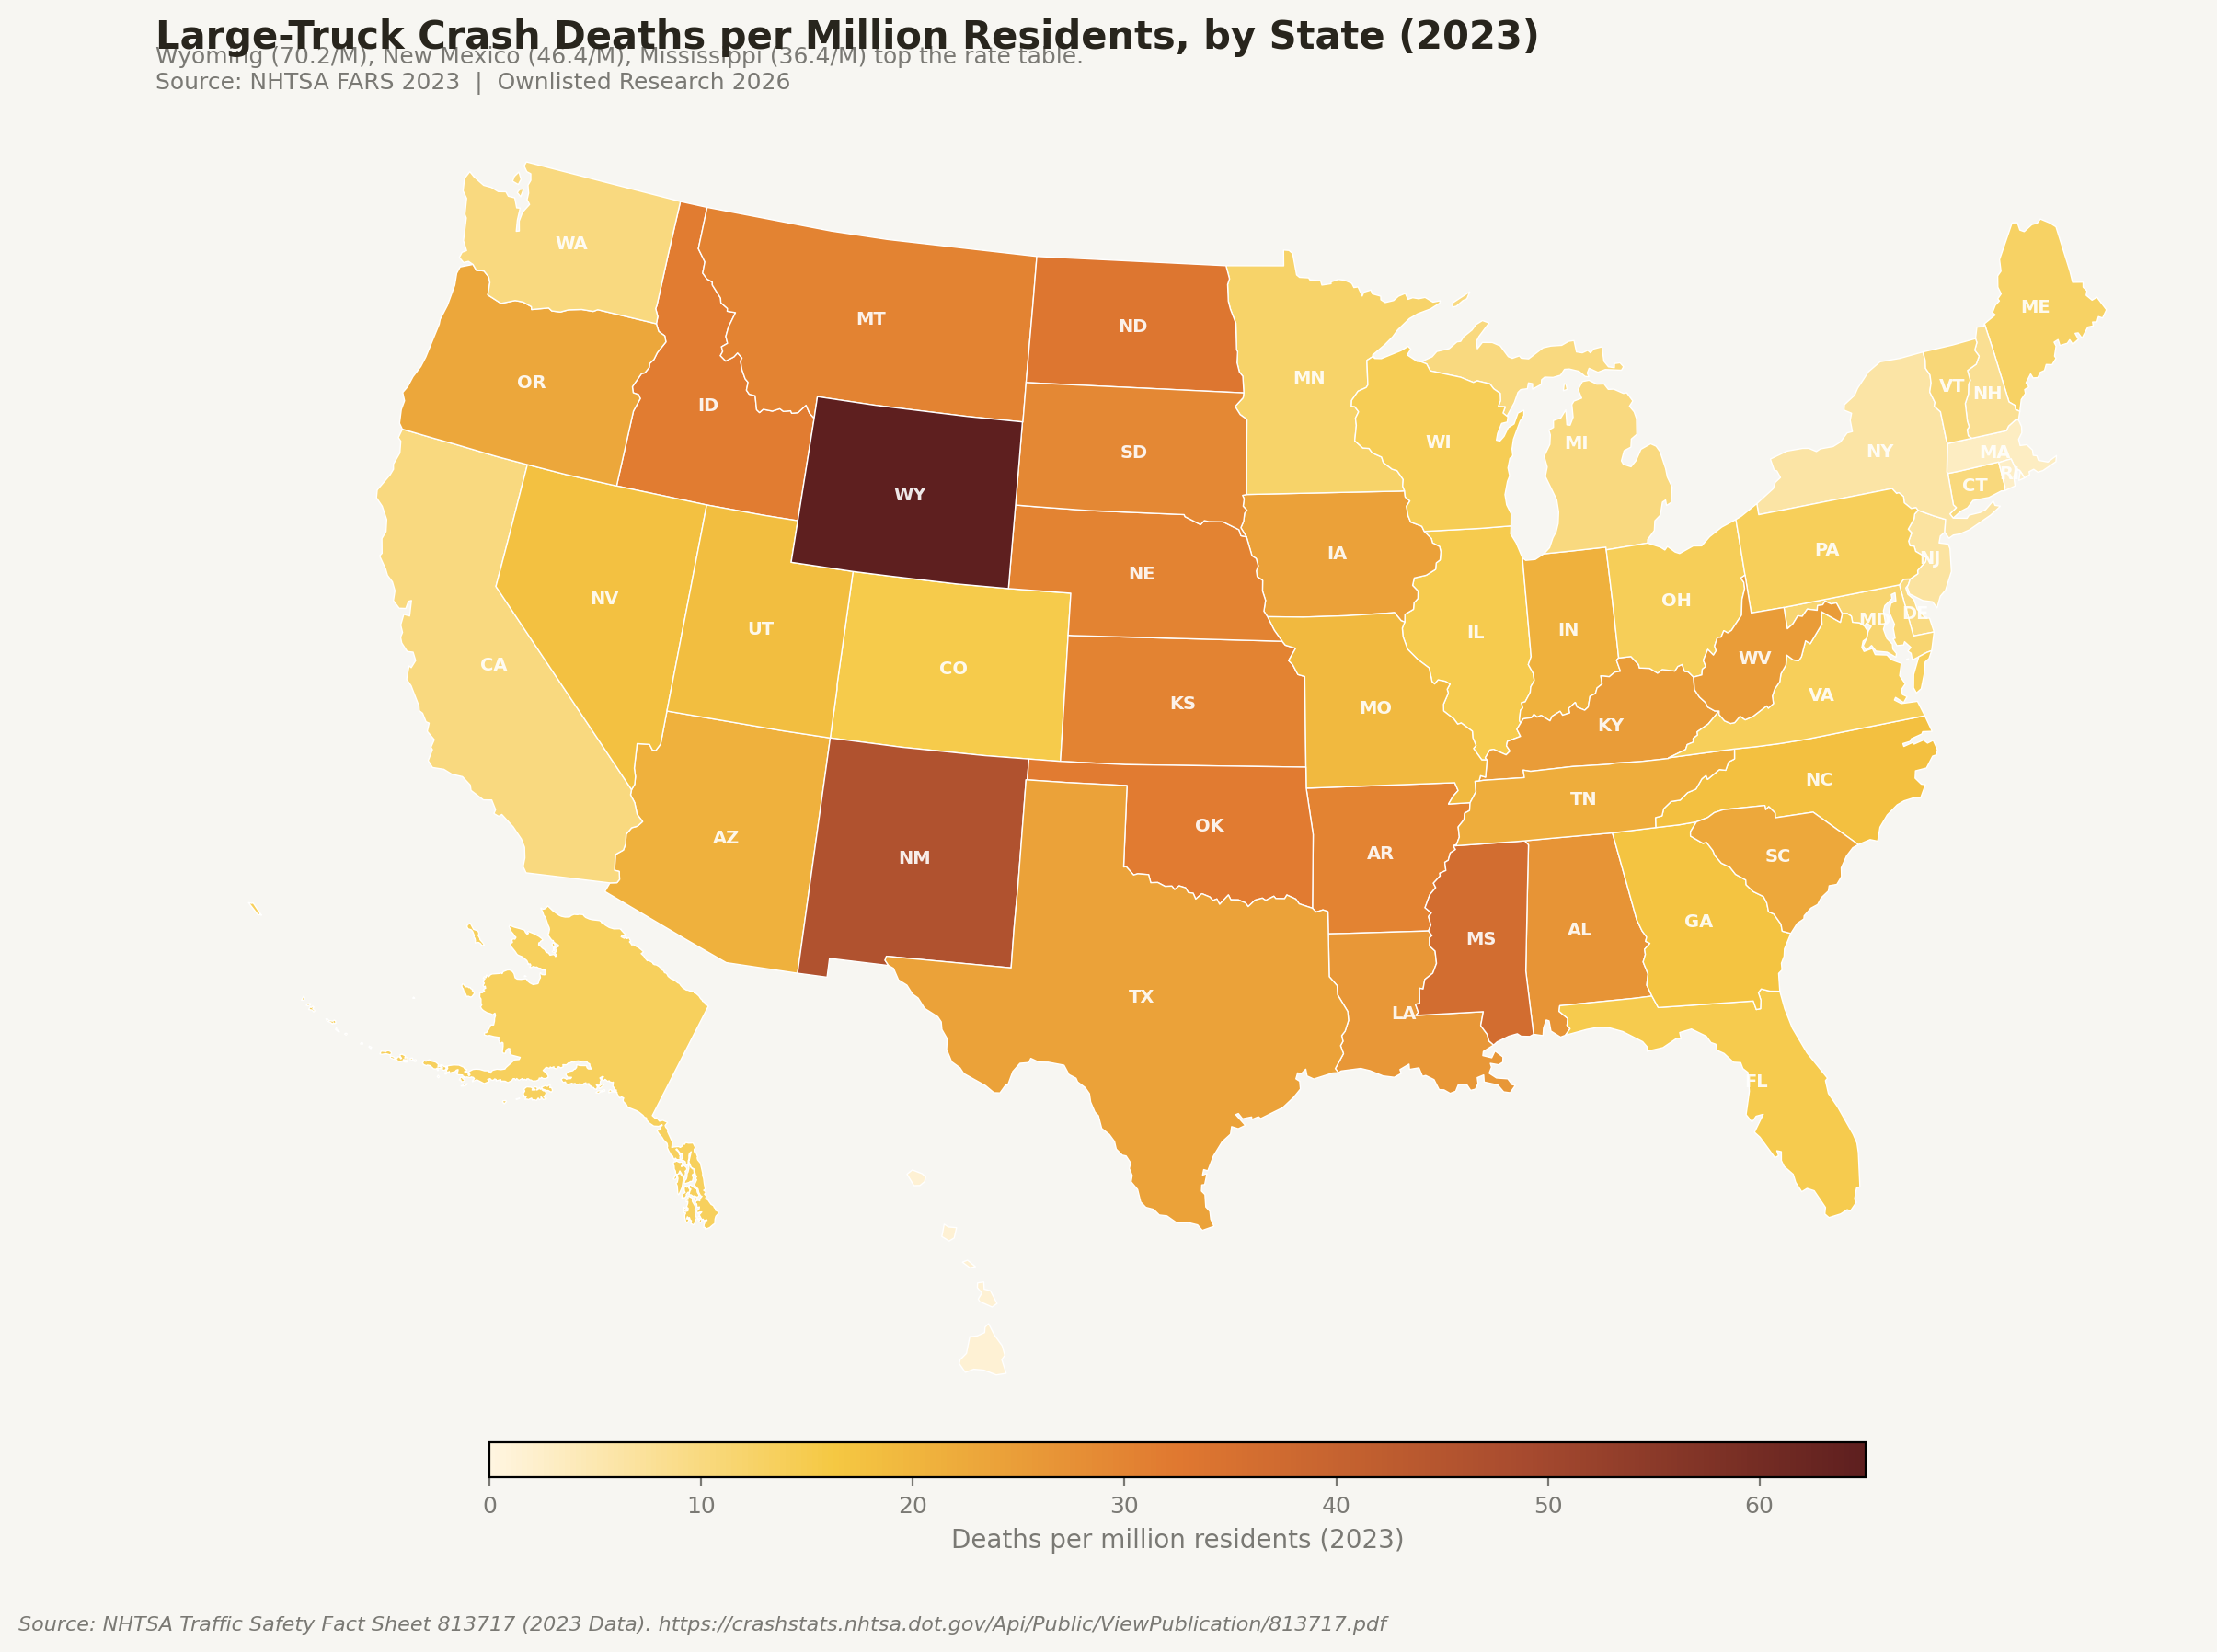
The geography of those crashes is not random. Roughly 55% of fatal large-truck crashes occurred on rural roads; 25% on interstates. States with high freight-corridor density — Texas, Mississippi, Indiana — show disproportionate exposure. Wyoming recorded 70.2 large-truck fatalities per million residents in 2023, the highest rate in the country.

This study cross-references 3,272 truck-accident attorneys from the Ownlisted directory with state-level fatality data from NHTSA FARS 2023, producing a state-by-state "representation gap" score.

Horizontal bar chart showing the top 30 US states by truck-accident attorney count, led by California (643), Texas (341), and Florida (218).
Truck-Accident Attorneys by State — Top 30California (643), Texas (341), and Florida (218) lead by raw count. Source: Ownlisted directory, April 2026.
JSON dataCSV data
Horizontal bar chart showing large-truck crash fatalities by state for the top 20 states in 2023, led by Texas (730), California (392), and Florida (341).
Large-Truck Crash Fatalities by State — Top 20Texas (730) leads by a wide margin — more deaths than the next three states combined. Source: NHTSA FARS 2023.
JSON dataCSV data

The Representation Gap: Where Victims Have Fewest Attorneys

The representation gap measures the mismatch between where fatal large-truck crashes occur and where truck-accident attorneys practice. The gap score equals (large-truck fatalities per million residents) ÷ (directory attorneys per million residents). A high score means many victims, few attorneys.

South Carolina records 22.7 large-truck fatalities per million residents but lists fewer than 4 attorneys per million — a gap score of 6.1, the widest among states with any representation. Mississippi (5.4) and New Mexico (4.9) follow.

Pennsylvania is the most counterintuitive gap for a large state: 180 fatalities in 2023 (sixth-highest nationally), just 40 directory attorneys, and a gap score of 4.5.

Eight states have zero listed attorneys: Wyoming, Montana, North Dakota, West Virginia, Maine, Vermont, Delaware, and New Hampshire. Wyoming, with the highest per-capita fatality rate in the nation (70.2 per million), is among them.

Scatter plot comparing state-level large-truck crash fatalities to truck-accident attorney supply, showing positive correlation in large states but significant outliers including Pennsylvania (high fatalities, low attorneys) and California (high fatalities, very high attorneys).
Fatal Crashes vs. Attorney Supply by StateThe attorney-fatality correlation is strongest in the largest states but breaks down for mid-size and rural states. Source: Ownlisted + NHTSA FARS 2023.
JSON dataCSV data
Horizontal bar chart showing the 15 US states with the highest truck-accident representation gap scores, led by South Carolina (6.1), Mississippi (5.4), and New Mexico (4.9).
Representation Gap Score — Top 15 Most Underserved StatesGap score = (fatalities per million residents) ÷ (attorneys per million residents). Higher is worse. Source: Ownlisted + NHTSA FARS 2023.
JSON dataCSV data
US choropleth map showing large-truck crash deaths per million residents by state in 2023, with Wyoming (70.2), New Mexico (46.4), and Mississippi (36.4) showing the darkest shading.
Large-Truck Crash Deaths per Million ResidentsRural freight-corridor states have disproportionately high fatality rates. Source: NHTSA FARS 2023 + 2024 Census estimates.
JSON dataCSV data

The Attorney Market: Reviews and Market Concentration

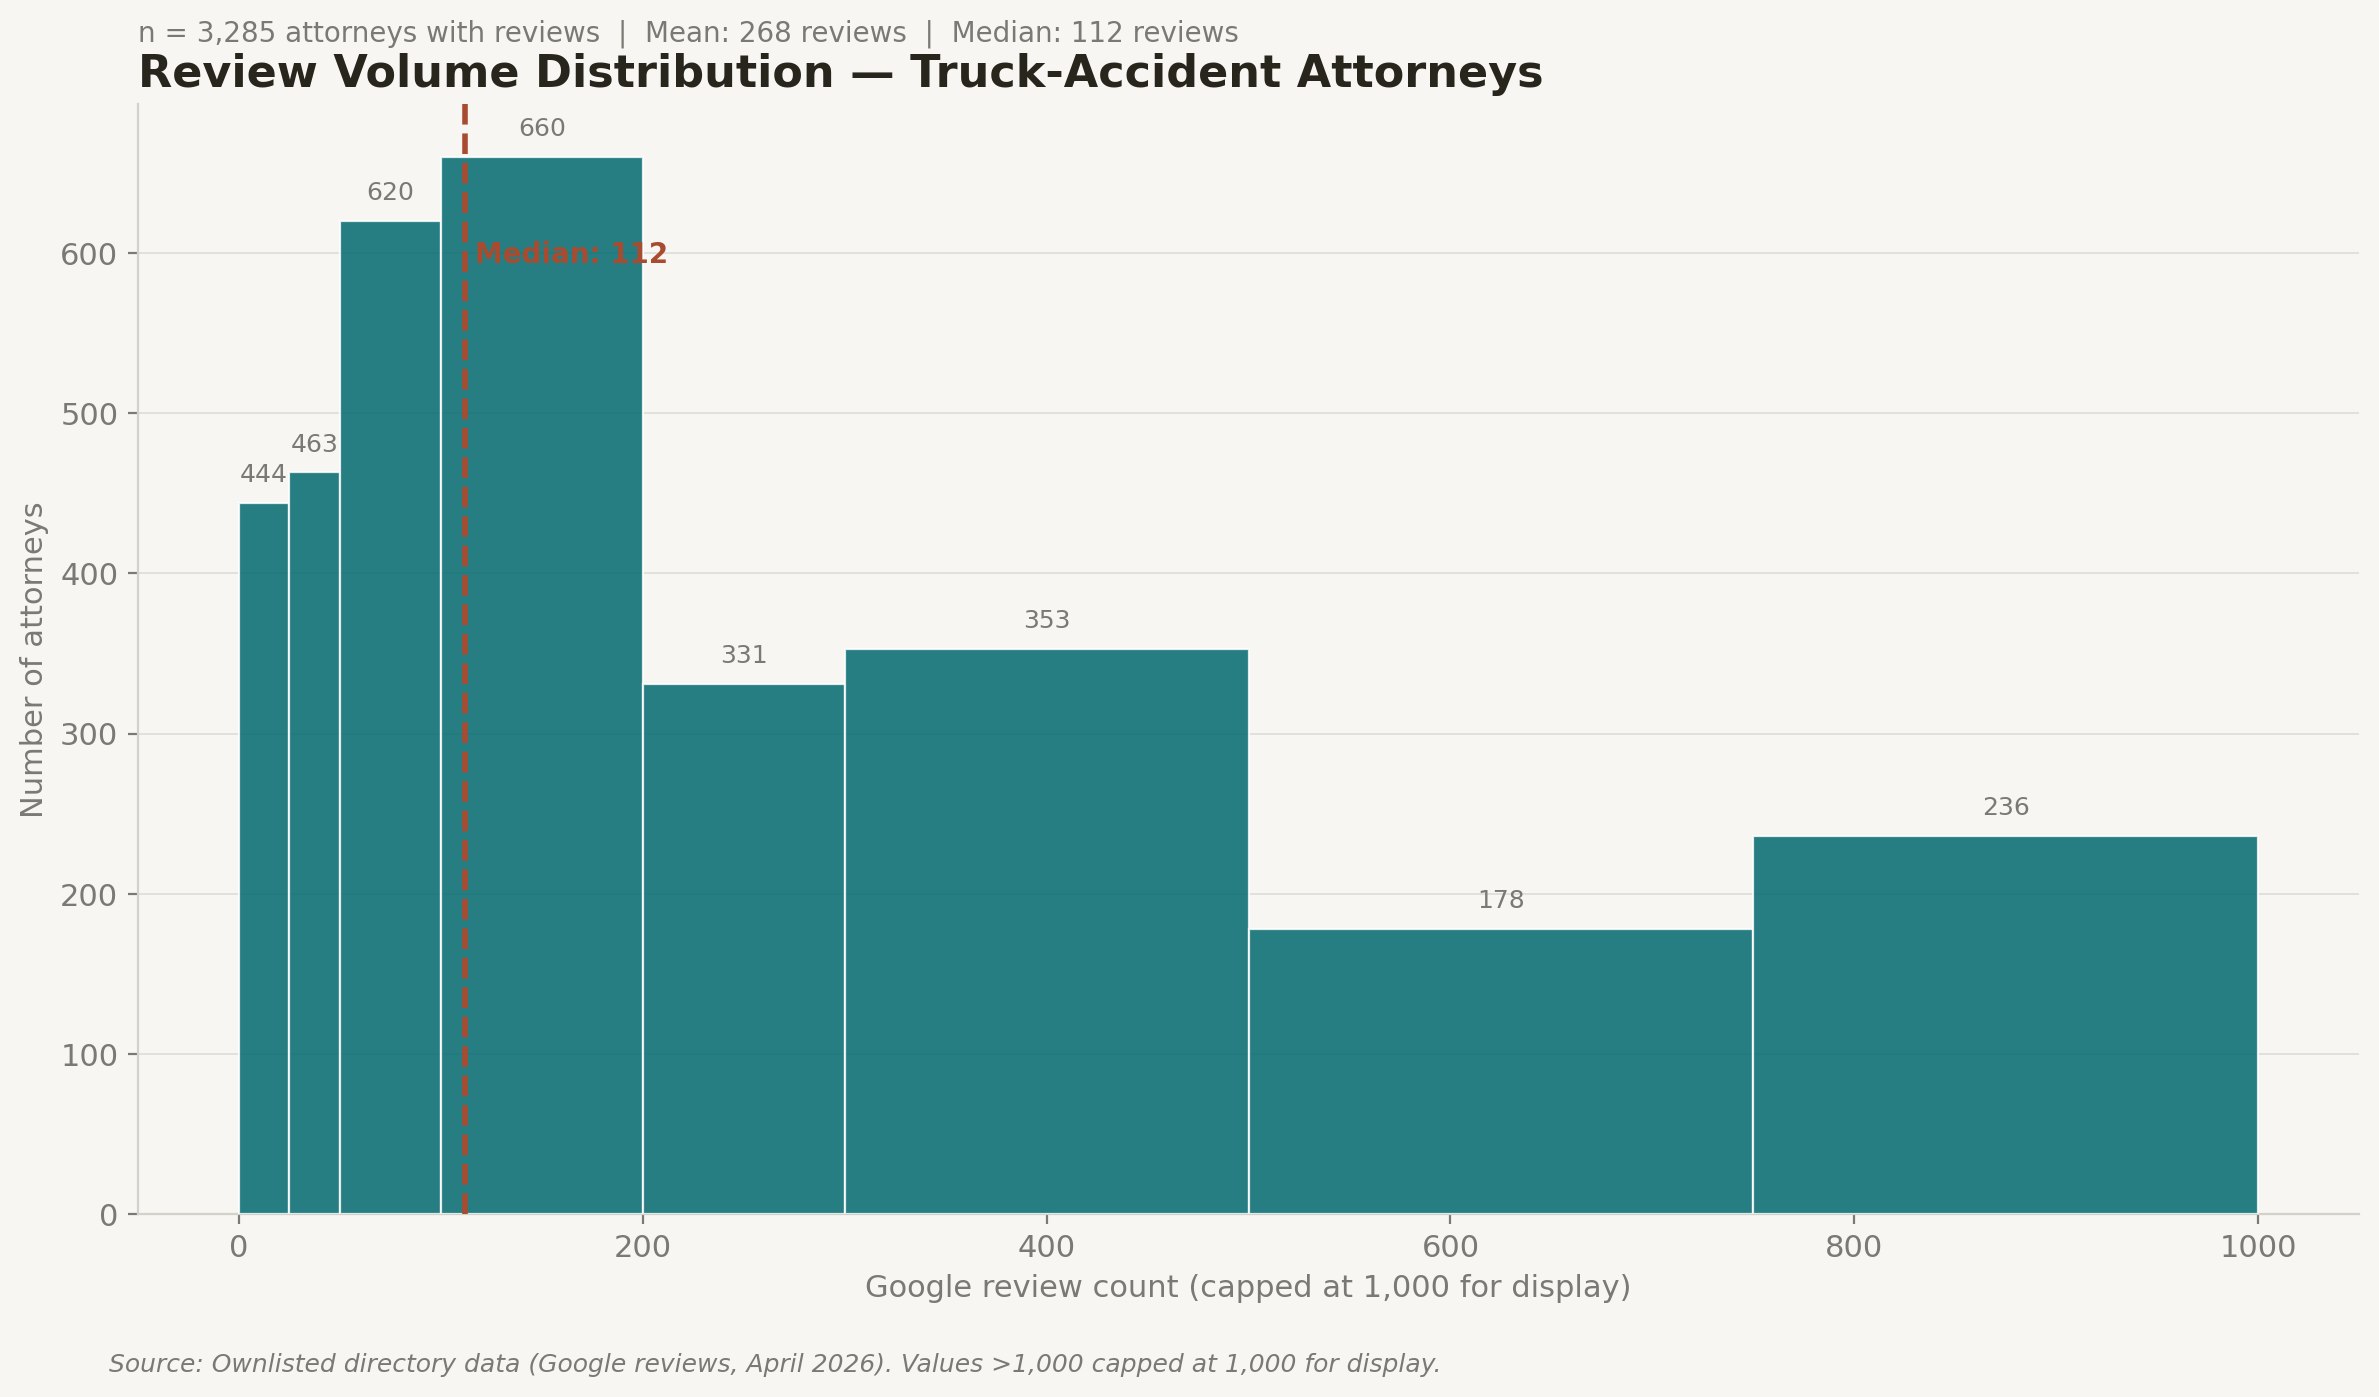
Review distribution: The median truck-accident attorney carries 110 Google reviews. The top quartile averages more than 500. States including Florida (avg 463 reviews per attorney), Georgia (535), and Rhode Island (499) show the highest average review accumulation.

Rating uniformity: Average ratings across states range only from 4.74 to 4.92 — effectively uniform. Review volume, not star rating, is the more informative signal for assessing attorney market presence.

California dominates by raw count with 643 attorneys — nearly double second-ranked Texas. After the top five states (CA, TX, FL, AZ, NC), attorney supply falls sharply, with most states in the 20–80 range.

Histogram showing truck-accident attorney distribution across review count ranges, with the largest bars in the 25-100 range and a long tail of high-review established practices.
Review Volume Distribution — Truck-Accident AttorneysThe median attorney holds 110 reviews. The top 4% exceed 500 — market is concentrated among established practices. Source: Ownlisted, April 2026.
JSON dataCSV data

Frequently Asked Questions

How many fatal large-truck crashes happen in the US each year?
In 2023, 5,472 people were killed in traffic crashes involving large trucks, according to NHTSA FARS. That is 40% higher than a decade ago. Large-truck crashes accounted for roughly 13.4% of all US traffic fatalities in 2023.
Which states have the most fatal large-truck crashes?
Texas led with 730 deaths involving large trucks in 2023 — more than the combined total of California (392), Florida (341), and North Carolina (192). Together those three states accounted for 26.7% of all US large-truck fatalities.
Which states have the most truck-accident attorneys?
California (643), Texas (341), and Florida (218) lead the Ownlisted directory by absolute count as of April 2026.
What is the representation gap in truck-accident legal services?
The representation gap measures the mismatch between where fatal large-truck crashes occur and where attorneys practice. Among states with any attorneys listed, South Carolina scores 6.1, Mississippi 5.4, and New Mexico 4.9 — the three most underserved jurisdictions.
What states have no truck-accident attorneys listed?
As of April 2026, eight states — Wyoming, Montana, North Dakota, West Virginia, Maine, Vermont, Delaware, and New Hampshire — have no attorneys listing truck accident as a practice area in the Ownlisted directory.
How do truck-accident cases differ from general personal-injury claims?
Commercial truck accident litigation typically involves federal FMCSA regulatory frameworks, multi-defendant discovery across the driver, carrier, and shipper, Electronic Logging Device (ELD) data subpoenas, and accident reconstruction specialists. It is a distinct subspecialty of the plaintiff's bar.

Methodology

Attorney count. Active listings in the Ownlisted truck-accident attorney directory as of April 2026, drawn from Google Business Profile data for attorneys listing truck accident or commercial vehicle accident as a practice area. The directory includes attorneys with an active online listing; it is not a comprehensive census of all licensed attorneys who handle these cases.

Fatality data. State-level large-truck crash fatalities from the NHTSA Traffic Safety Fact Sheet (Report 813717), based on the 2023 Fatality Analysis Reporting System. "Large trucks" defined as vehicles with GVWR greater than 10,000 pounds.

Representation gap score. Calculated as (large-truck fatalities per million residents) ÷ (directory attorneys per million residents). Higher scores indicate more victims relative to attorney supply. States with zero attorneys are excluded from gap scoring (their absolute shortage is noted separately).

Population data. 2024 state-level population estimates from the US Census Bureau.

Review and rating data. Sourced from Google Business Profile data as captured by the Ownlisted directory as of April 2026.

Limitations. Our directory may not capture every truck-accident attorney in a given state. Attorneys may handle these cases without listing it as a primary practice area. Gap scores measure listed attorney density against crash exposure — they do not measure attorney quality, case outcomes, or accessibility (fee structures, geographic reach, etc.).

Not legal advice. This study is a quantitative analysis of market conditions. It does not constitute legal advice and does not endorse any specific attorney or practice.

Cite this study

Ownlisted Research. (2026). The 2026 US Truck Accident Attorney Landscape: Where Victims Find Legal Help. Ownlisted. https://ownlisted.com/research/truck-accident-legal-landscape-2026
https://ownlisted.com/research/truck-accident-legal-landscape-2026
@misc{ownlisted2026truckaccidentlegallandscape2026, author = {Ownlisted Research}, title = {The 2026 US Truck Accident Attorney Landscape: Where Victims Find Legal Help}, year = {2026}, url = {https://ownlisted.com/research/truck-accident-legal-landscape-2026}, note = {Accessed: 2026-04-24} }

Directory

Find a truck accident attorney near you

Browse our directory of listed truck accident attorneys across thousands of cities. Compare ratings, read reviews, and connect directly.

Explore Truck Accident Attorneys

Related research

Medical Weight Loss Clinics

The 2026 US Medical Weight Loss Market: 3,039 Clinics Mapped Across America

April 2026

Ownlisted Research

Original data on the home services & professional services industries.

All StudiesPress & DataEditorial PolicyPrivacypress@ownlisted.com

© 2026 Ownlisted. Data is provided for informational purposes. Free to cite with attribution and a link back. See our editorial policy.